What is UML and why you may want to care
UML isn't about designing the solution. It's about organizing the domain of the problem.
What is UML?
Unified Modeling Language (UML) began when Ivar Jacobsen, James Rumbaugh and Grady Booch, collectively known as “The Three Amigos,” joined forces in the mid-1990s to unify their individual modeling approaches into one.
UML provides a means of modeling different aspects of the software development process, most closely associated with the Object Oriented Programming paradigm. UML specifies 17 types of diagrams. It’s intended to be informal enough so that diagrams can be easily drawn by hand on white boards and formal enough so UML specific software, such as modeling tools to draw diagrams, generating code from those diagrams, and generating diagrams from the code.
UML is a specification managed by the Object Modeling Group (OMG).
Its demise
UML flamed hot, then cooled. It’s rarely taught in universities. It’s not used often in industry. What happened?
It became too popular and bloated with features. The UML 2.5.1 specification from late 2017 is almost 800 pages long. Some of the automated tools were not great. Too many software processes required its use too rigidly. Many of us were forced to create too many unnecessary UML documents with tools that could be too cumbersome to use. It left a bad impression for many.
I was fortunate enough to have been exposed to UML before it was rammed down our throats. A little can go a long way. Of the 17 diagrams, I use one about 95% of the time. I use a few others, but only sparingly. I also don’t use all the notations. The specification may be 800 pages long, but I could probably document the parts I use in about 4 pages.
UML is a tool. It should work for us. We should not work for it. Use as much or as little of it to suit your needs.
When I realized how to use them
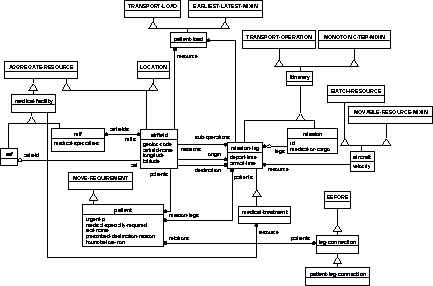
My first experience was with one of UML’s predecessors, the Object Modeling Technique (OMT), defined by Rumbaugh. It most closely resembles UML’s Class Diagrams. The diagrams in the Gang of Four’s Design Pattern book use OMT.
Here’s a sample diagram, just to provide a sense of what OMT looked like (Source: CMU’s Medevac Domain Object Model):

I had taken a rotation assignment as a system tester, what we’d now call QA, in the mid-1990s. I was assigned about 20 requirements to test. I could understand them individually, but I was having a problem understanding them as a cohesive unit. The result of one requirement seemed like an event to trigger for another requirement. One event seemed to change the nature and the state of the system as a whole as its impact propagated.
I brought a copy of the requirements home. I cut my requirements into separate pieces of paper and spread them across the living room floor. I clustered requirement that seemed to relate to another, but I still wasn’t seeing the entire picture.
Then one Sunday morning in church, I was getting a little bored during the sermon and my mind started to wander; sorry, Pastor Nichols. I was thinking about the requirements, and I thought something like: X IS-A Y, and then X HAS-A Z. These were basic relationships defined in the requirements. I started to envision my requirements as a diagram where the requirements formed relationship lines among the entities defined in the requirement.
I grabbed my set of requirements, a blank sheet of paper and a pen next chance I had. As I read each requirement, I drew the relationship it described on the paper in a diagram like the one above. Each requirement was a new line connecting elements in the system.
When I was done, the entire set of 20 requirements fit on one sheet of paper. It was a roadmap. I could see its cohesiveness. I could follow the propagation flow of one trigger as it propagated through the system. It all made sense.
UML is often used as a development tool. That may not be the right focus. I was not a developer for that assignment. I was not using OMT (UML’s predecessor) to implement a solution. I was using OMT to understand the problem.
The value of UML is not to define the solution. The value of UML is helping understand the domain of the problem. This work often leads to an implementation, but I don’t think that’s its main value.
My Favorite Diagrams
I only use a few UML diagrams. Here are the ones I tend to use.
Class Diagrams
Class diagrams are by far my most frequently used UML diagram. I tend to use them to understand the relationships among the elements of my domain. This often evolves into a solution as well. The diagrams tend to be easier to read and easier to write than the OMT diagrams.
Class diagrams represent classes as rectangles. This includes abstract classes and interfaces too. The representation includes their attributes, methods, and their relationship to other classes. These relationships come in 3 forms:
- Reference, which tends to be an unadorned line between two classes.
- Inheritance/Implements/Extends, which is represented by a triangle pointing to the base class. It represents an IS-A relationship.
- Composition/Aggregation, which is represented by a diamond that represents the collector of a set of other classes. It represents a HAS-A relationship.
- Composition is a closed diamond indicating that the collection is an integral part of the whole. For example, a runner has-a heart and two lungs. When a runner runs, this propagates an effect on the heart to beat faster and the lungs to breath harder. None survives unless part of the whole.
- Aggregation is an open diamond indicating that the collection is managed. For example, a runner has many pairs of shoes. Other than wear and tear, they are not affected by running. The runner and shoes can both exist even when not being worn.
The lines can also contain arrows indicating dependency, so A -> B means that A depends upon B, but not the other direction. It also means that A probably invokes a method upon B.
Finally, some relationships have multiplicity. This is usually with Composition or Aggregation. For example, in the above a runner has 1 heart and 2 lungs. This will not vary. But the runner may possess any number of shoes. Multiplicity is often represented by a number or range of numbers where the relationship line connects to the rectangle class. A star, *, represents any number of instances, including zero.
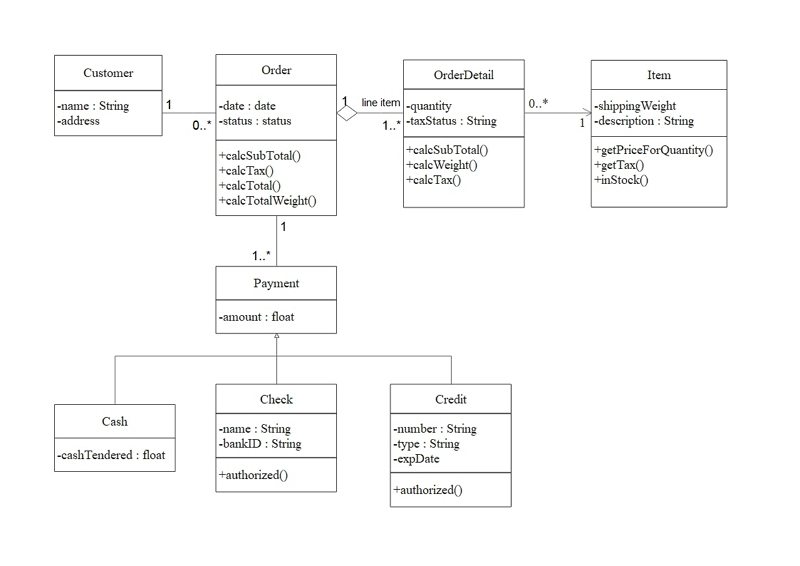
Here’s a sample taken from EdrawMax UML Class Diagrams Explained. 
Let’s consider some of the relationships in the above:
- A Customer may have any number of Orders. A solitary * would have worked instead of 0..* as well.
- An Order can only be submitted by one Customer.
- And Order has at least one OrderDetail.
- Any Order can be paid by at least one Payment method.
- Cash is a Payment method.
- Check is a Payment method.
- Credit is a Payment method.
I don’t usually use this much detail in each class. I don’t tend to include the attributes, such as name, address, or date. I only include the methods that are important.
Class Diagram References:
- Wikipedia Class Diagrams
- What is Class Diagram?
- UML Class Diagram Tutorial
- Class Diagram Explained
- UML Class Diagram Tutorial - Video
Other Diagrams
The other three diagrams that I tend to favor, but to a much lesser degree are: Use Case Diagrams, State Diagrams and Sequence Diagrams, but those are topics for another day.
